What Is Annual Recurring Revenue: ARR Explained

Understanding what is annual recurring revenue represents a fundamental requirement for anyone operating in the subscription economy. This metric serves as the cornerstone for evaluating business health, forecasting growth, and attracting investors in SaaS and subscription-based companies. Unlike one-time sales or unpredictable revenue streams, ARR provides a clear snapshot of the predictable income your business generates from subscriptions over a twelve-month period. Whether you're a founder tracking growth, a marketer measuring campaign effectiveness, or an analyst evaluating company performance, mastering this concept unlocks strategic insights that drive better decision-making.
Defining Annual Recurring Revenue
Annual recurring revenue (ARR) represents the value of recurring revenue normalized to a one-year period. This metric captures the predictable, subscription-based income a company expects to receive annually from its customers, excluding one-time fees, professional services, or variable charges. ARR serves as a standard metric for measuring the size and growth trajectory of subscription businesses, providing stakeholders with a clear view of sustainable revenue streams.
The fundamental principle behind what is annual recurring revenue centers on predictability. When a customer signs a twelve-month contract for $12,000, that represents $12,000 in ARR. When a customer subscribes monthly at $100, that contributes $1,200 to ARR ($100 × 12 months). This normalization creates consistency across different subscription models and billing frequencies.
Key Components of ARR
ARR comprises several distinct revenue categories that collectively paint a complete picture of subscription performance:
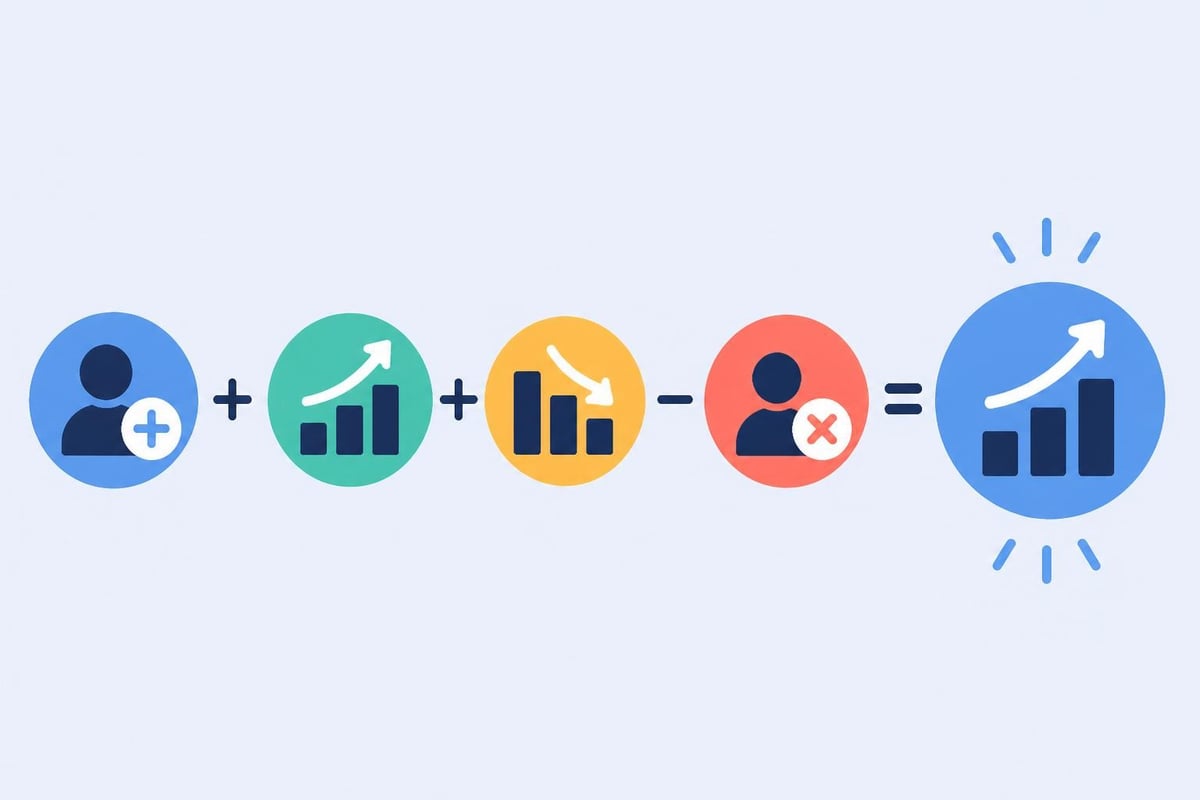
- New ARR: Revenue from brand-new customers acquired during the period
- Expansion ARR: Additional revenue from existing customers through upgrades, add-ons, or increased usage
- Contraction ARR: Lost revenue from downgrades or reduced subscription levels
- Churned ARR: Revenue lost entirely from canceled subscriptions
- Net New ARR: The sum of new and expansion ARR minus contraction and churned ARR
Understanding these components helps businesses identify which growth levers drive performance and where vulnerabilities exist in the customer base.
Calculating Annual Recurring Revenue
The basic ARR calculation follows a straightforward formula, though implementation requires careful attention to what qualifies as recurring revenue. The standard approach multiplies monthly recurring revenue (MRR) by twelve, or aggregates all annual subscription values currently under contract.
Basic ARR Formula: ARR = MRR × 12
Alternative ARR Calculation: ARR = (Total Annual Subscription Value of All Active Contracts)
Step-by-Step Calculation Example
Consider a SaaS company with the following subscription base at the end of December 2026:
- Identify recurring subscription revenue: Exclude setup fees, consulting charges, or one-time purchases
- Determine monthly subscription value: Calculate total monthly subscriptions across all customers
- Annualize the monthly figure: Multiply by 12 to project annual value
Practical Example:
| Customer Segment | Monthly Subscribers | Price per Month | Monthly Revenue | Annual Contribution |
|---|---|---|---|---|
| Starter Plan | 150 | $29 | $4,350 | $52,200 |
| Professional Plan | 75 | $99 | $7,425 | $89,100 |
| Enterprise Plan | 20 | $499 | $9,980 | $119,760 |
| Total | 245 | - | $21,755 | $261,060 |
This company's ARR equals $261,060. Following established calculation methods ensures consistency and accuracy when tracking this metric over time.
What NOT to Include in ARR
Many businesses make the mistake of inflating ARR by including non-recurring elements:
- Setup or implementation fees
- One-time professional services
- Variable usage charges (unless predictable and contractual)
- Non-subscription product sales
- Credits or promotional discounts that won't recur
Maintaining strict boundaries around what is annual recurring revenue preserves its value as a predictive metric. Understanding ARR's role in reflecting predictable revenue helps businesses avoid common calculation errors.
ARR Versus MRR: Understanding the Difference
Monthly Recurring Revenue (MRR) and ARR measure similar concepts but serve different strategic purposes. While both track subscription income, the timeframe difference creates distinct use cases that matter for various stakeholders.
MRR measures subscription revenue on a monthly basis, providing granular insight into short-term trends. This metric helps operational teams identify immediate changes in customer behavior, track month-over-month growth rates, and respond quickly to emerging patterns.
ARR projects that monthly revenue across a full year, offering a macro perspective that appeals to investors, board members, and long-term strategic planners. The annual view smooths out monthly fluctuations and seasonal variations.

When to Use Each Metric
| Situation | Preferred Metric | Reason |
|---|---|---|
| Board presentations | ARR | Aligns with annual planning cycles |
| Investor discussions | ARR | Standard valuation benchmark |
| Monthly team meetings | MRR | Tracks immediate performance |
| Operational adjustments | MRR | Enables rapid response to trends |
| Company valuation | ARR | Industry standard for comparisons |
| Sales team quotas | MRR | Matches commission cycles |
For early-stage companies with rapidly changing customer bases, MRR provides more actionable insights. As businesses mature and customer lifetime extends, what is annual recurring revenue becomes increasingly valuable for strategic planning.
Why SaaS Companies Prioritize ARR
The subscription economy transformed how software companies generate revenue, and ARR emerged as the critical metric for measuring success in this model. Unlike traditional software sales where companies recognized revenue upon license purchase, SaaS businesses spread revenue recognition across the subscription period.
Strategic Benefits of Tracking ARR
Predictability drives operational planning. When you understand the baseline revenue your current customer base will generate over the next twelve months, you can confidently invest in growth initiatives, hire team members, and commit to infrastructure expenses.
Investor communication becomes standardized. ARR's critical importance for SaaS companies and investors stems from its universal adoption as the industry standard. Venture capitalists, private equity firms, and public market analysts all evaluate SaaS companies primarily through ARR metrics.
Valuation multiples rely on ARR. SaaS companies typically trade at multiples of ARR, making this metric directly tied to company value. A business generating $5 million in ARR might command a 10x multiple, yielding a $50 million valuation.
Growth trajectories become measurable. Year-over-year ARR growth rates signal whether a company is accelerating, maintaining steady growth, or decelerating. These patterns inform strategic pivots and resource allocation.
ARR in Marketing and Growth Strategies
Marketing teams leverage ARR insights to optimize customer acquisition and expansion strategies. Understanding which customer segments contribute most to ARR growth helps prioritize marketing spend and campaign development.
When evaluating marketing campaign performance, smart businesses look beyond immediate conversion metrics to track ARR impact. A campaign generating 100 new customers at a $50 monthly subscription contributes $60,000 to ARR ($50 × 12 × 100). Comparing this ARR contribution against campaign costs reveals true ROI.
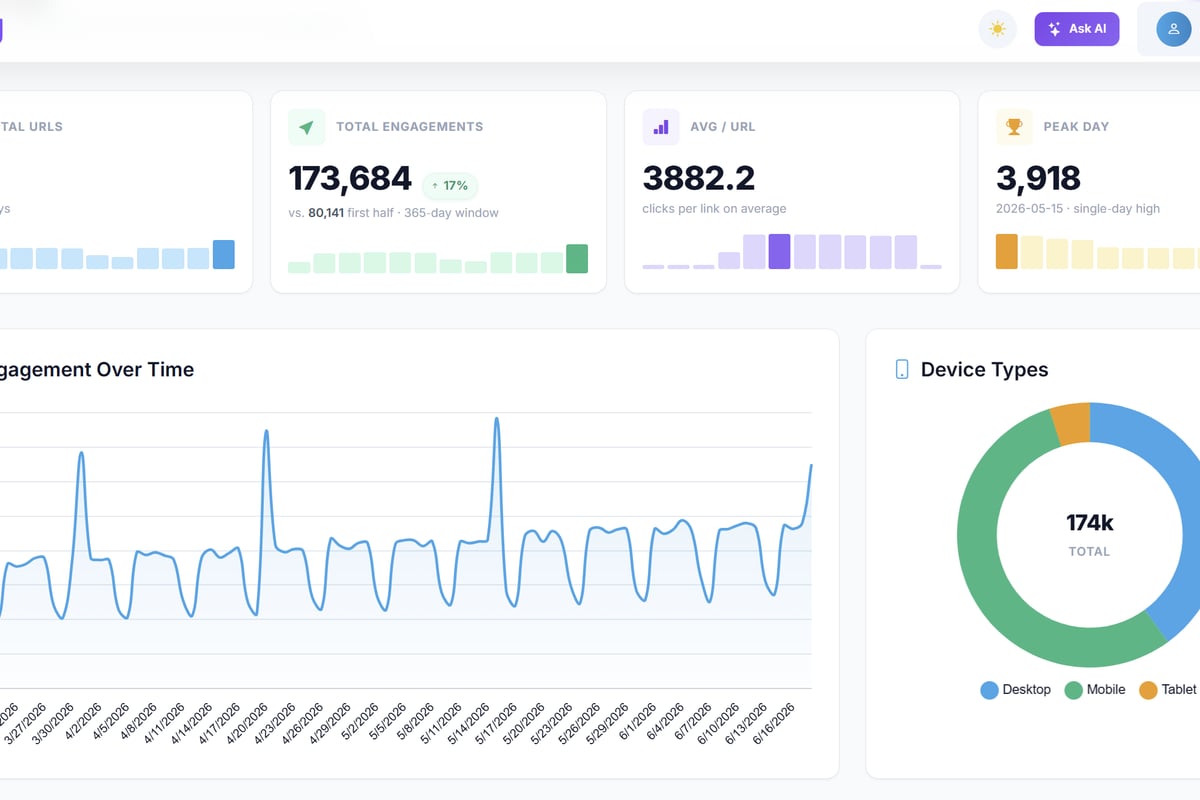
Link management platforms like Trimy enable marketers to connect campaign performance directly to revenue outcomes by tracking which links, channels, and messages drive the highest-value subscriptions. This intelligence transforms marketing from a cost center into a measurable revenue driver.
Strategies for Growing Annual Recurring Revenue
Increasing what is annual recurring revenue requires a balanced approach across four primary growth vectors. Companies that excel at ARR growth don't rely on a single strategy but orchestrate multiple initiatives simultaneously.
Acquisition: Adding New Customers
New customer acquisition represents the most obvious path to ARR growth but often carries the highest cost. Successful acquisition strategies focus on:
- Targeting ideal customer profiles with the highest lifetime value potential
- Optimizing conversion funnels to reduce friction in the signup process
- Implementing product-led growth that lets users experience value before purchasing
- Developing partnership channels that provide qualified leads at lower acquisition costs
Calculate the ARR contribution of acquisition efforts by multiplying new customer count by average subscription value and twelve months.
Expansion: Growing Existing Accounts
Expansion revenue frequently delivers higher ROI than new customer acquisition because existing customers already trust your product. Strategies for SaaS companies to grow ARR often emphasize expansion as the most efficient growth lever.
Effective expansion tactics include:
- Tiered pricing that encourages upgrades as usage grows
- Feature gating that creates natural upgrade paths
- Usage-based pricing components that scale with customer success
- Cross-selling complementary products or modules
- Annual contract incentives that increase commitment levels
Retention: Preventing Churn
Every dollar of churned ARR requires new revenue to replace it before achieving net growth. Companies with annual churn rates above 10% face significant headwinds in scaling ARR.
Retention strategies that protect ARR:
- Proactive customer success programs identifying at-risk accounts
- Regular business reviews demonstrating ongoing value
- Product improvements addressing common cancellation reasons
- Pricing flexibility for customers facing temporary budget constraints
- Community building that increases switching costs
Contraction Mitigation: Minimizing Downgrades
Contraction occurs when customers reduce their subscription level without completely churning. While less damaging than full churn, contraction still erodes ARR and signals potential future cancellations.
| Growth Vector | Impact on ARR | Typical Cost | Speed to Impact |
|---|---|---|---|
| New Acquisition | High | High | Medium |
| Expansion | Medium-High | Low | Fast |
| Retention Improvement | Medium | Medium | Slow |
| Contraction Reduction | Low-Medium | Low | Medium |
Common ARR Mistakes and How to Avoid Them
Even experienced finance teams sometimes mishandle what is annual recurring revenue calculations, leading to inflated metrics that create false confidence or strategic misalignment.
Counting Non-Recurring Revenue
The most frequent error involves including one-time revenue sources in ARR calculations. Implementation fees, migration services, and custom development work may appear alongside subscription charges on invoices but don't represent recurring income.
Solution: Establish clear accounting policies that separate recurring subscription revenue from professional services and one-time fees. Train sales teams to structure contracts with distinct line items for each revenue type.
Recognizing ARR Before Contract Start Dates
When a customer signs an annual contract in December 2026 with a January 2027 start date, that ARR shouldn't appear in your December 2026 metrics. Key components and role in forecasting require accurate timing of when revenue recognition begins.
Solution: Align ARR recognition with contract effective dates rather than signature dates. This prevents premature counting and maintains metric integrity.
Including Unpaid or At-Risk Revenue
Customers with payment failures, expired credit cards, or outstanding collections don't contribute reliable ARR until payment issues resolve.
Solution: Segment ARR into categories including "Active and Current," "Payment Issues," and "At Risk" to maintain visibility into revenue quality.
Mixing ARR with Bookings
Bookings represent the total contract value signed during a period, which may include multi-year commitments. ARR reflects only the annual normalized value currently under contract.
A three-year contract worth $300,000 creates $300,000 in bookings but only $100,000 in ARR ($300,000 ÷ 3 years).
ARR Benchmarks and Industry Standards
Understanding what is annual recurring revenue means little without context. Industry benchmarks help companies evaluate whether their ARR growth, retention, and efficiency metrics signal strong performance or reveal areas needing improvement.
Growth Rate Benchmarks by Stage
Early Stage (ARR < $1M):
- Strong: 200%+ year-over-year growth
- Good: 100-200% year-over-year growth
- Concerning: <100% year-over-year growth
Growth Stage ($1M - $10M ARR):
- Strong: 100%+ year-over-year growth (triple-triple-double-double-double)
- Good: 50-100% year-over-year growth
- Concerning: <50% year-over-year growth
Scale Stage ($10M+ ARR):
- Strong: 40%+ year-over-year growth
- Good: 20-40% year-over-year growth
- Concerning: <20% year-over-year growth
ARR Efficiency Metrics
Magic Number measures sales and marketing efficiency by comparing new ARR generated to customer acquisition costs. A magic number above 0.75 indicates efficient growth, while figures below 0.5 suggest spending outpaces revenue generation.
Magic Number Formula: (Net New ARR in Quarter × 4) ÷ (Sales & Marketing Spend in Previous Quarter)
CAC Payback Period calculates how many months of subscription revenue are required to recover the cost of acquiring a customer. Best-in-class SaaS companies achieve payback periods under 12 months.
Net Revenue Retention reveals whether existing customers are expanding or contracting. Rates above 100% indicate expansion revenue exceeds churn and contraction, while rates below 100% signal a leaky bucket requiring constant new customer acquisition to maintain ARR.
Using ARR for Business Forecasting
Annual recurring revenue provides the foundation for accurate financial forecasting because it represents committed, predictable income. Finance teams build projections by modeling how ARR will evolve through various growth scenarios.
Building an ARR Forecast Model
Start with current ARR as the baseline, then project changes across each growth vector:
- Project new customer acquisition based on sales pipeline, conversion rates, and average contract values
- Estimate expansion revenue using historical upgrade rates and planned product launches
- Model expected churn based on cohort analysis and customer health scores
- Account for contraction using historical downgrade patterns
Example Forecast (Starting ARR: $1,000,000):
- New Customer ARR: +$300,000 (25 customers × $12,000 average)
- Expansion ARR: +$120,000 (12% of base from upgrades)
- Churned ARR: -$80,000 (8% annual churn rate)
- Contracted ARR: -$30,000 (3% downgrade rate)
- Projected Year-End ARR: $1,310,000
This represents 31% year-over-year growth driven primarily by new customer acquisition and strong expansion revenue.
Scenario Planning with ARR
Smart businesses model multiple ARR scenarios to prepare for different market conditions:
Conservative Case: Assumes lower close rates, higher churn, and reduced expansion Base Case: Uses historical averages and current pipeline strength Optimistic Case: Projects improved performance across all vectors
This range helps leadership teams make informed decisions about spending, hiring, and strategic initiatives while maintaining financial discipline.
What is annual recurring revenue ultimately represents more than just a metric-it's the heartbeat of subscription businesses, revealing growth trajectories, customer satisfaction, and long-term viability. By accurately calculating ARR, tracking its components, and using it to guide strategic decisions, SaaS companies position themselves for sustainable success. For marketing teams seeking to connect campaign performance directly to revenue outcomes, trimy provides the link intelligence and analytics needed to transform every click into measurable ARR impact, helping you optimize the campaigns that drive your most valuable subscriptions.