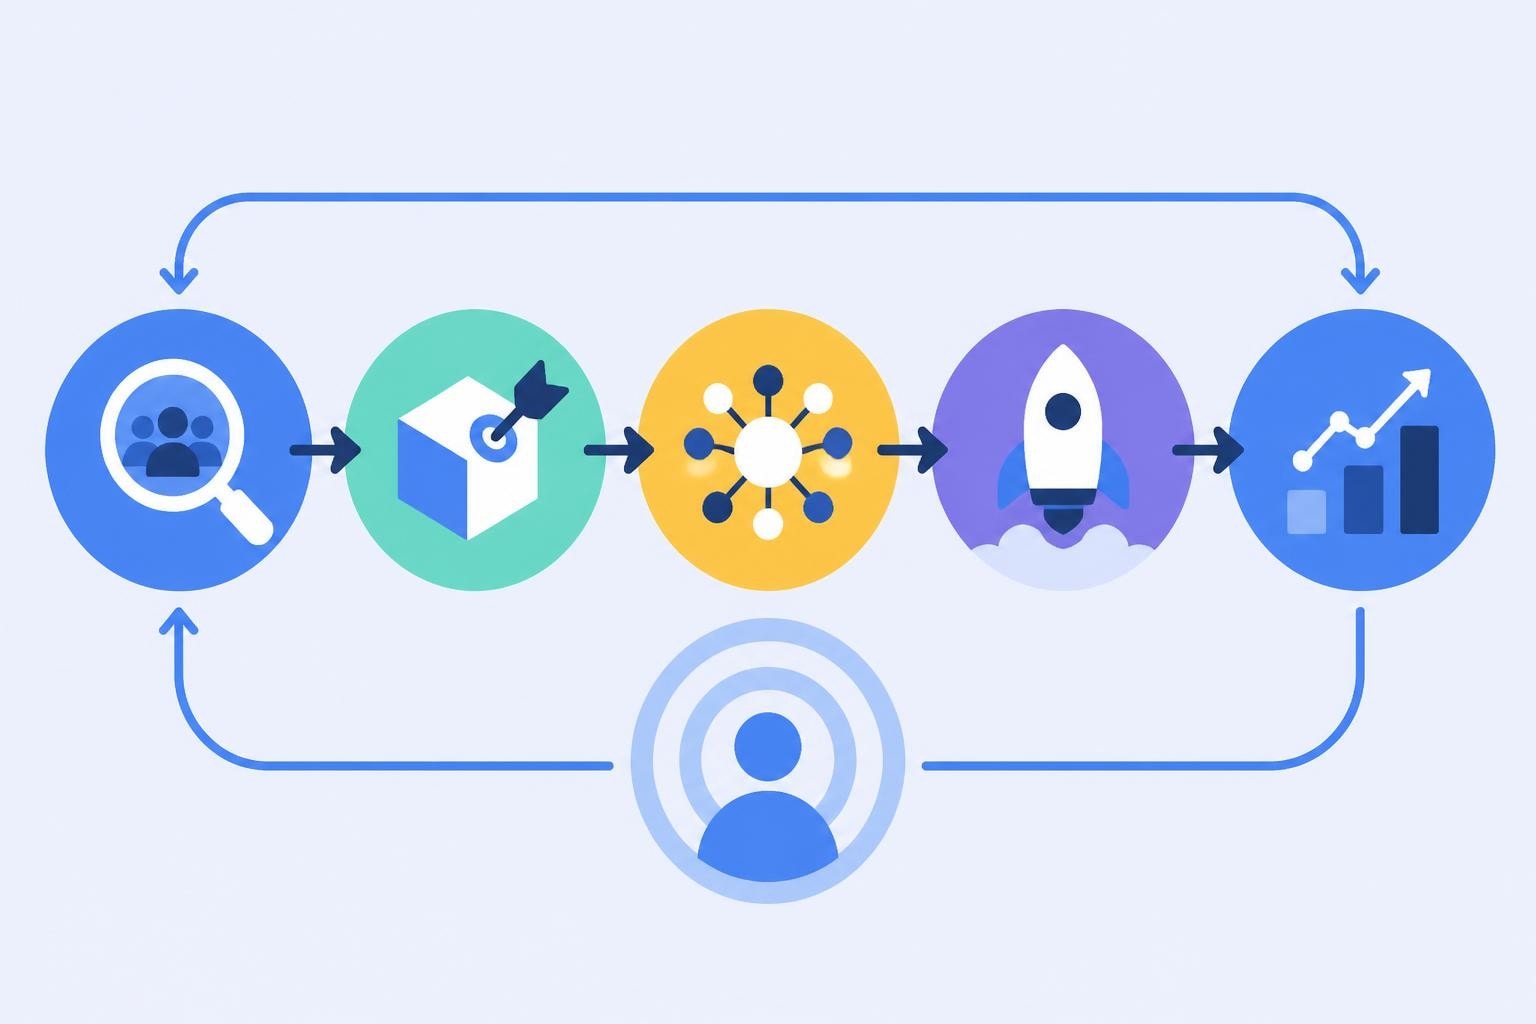
Optimize Conversion Rate: A Guide for Marketers
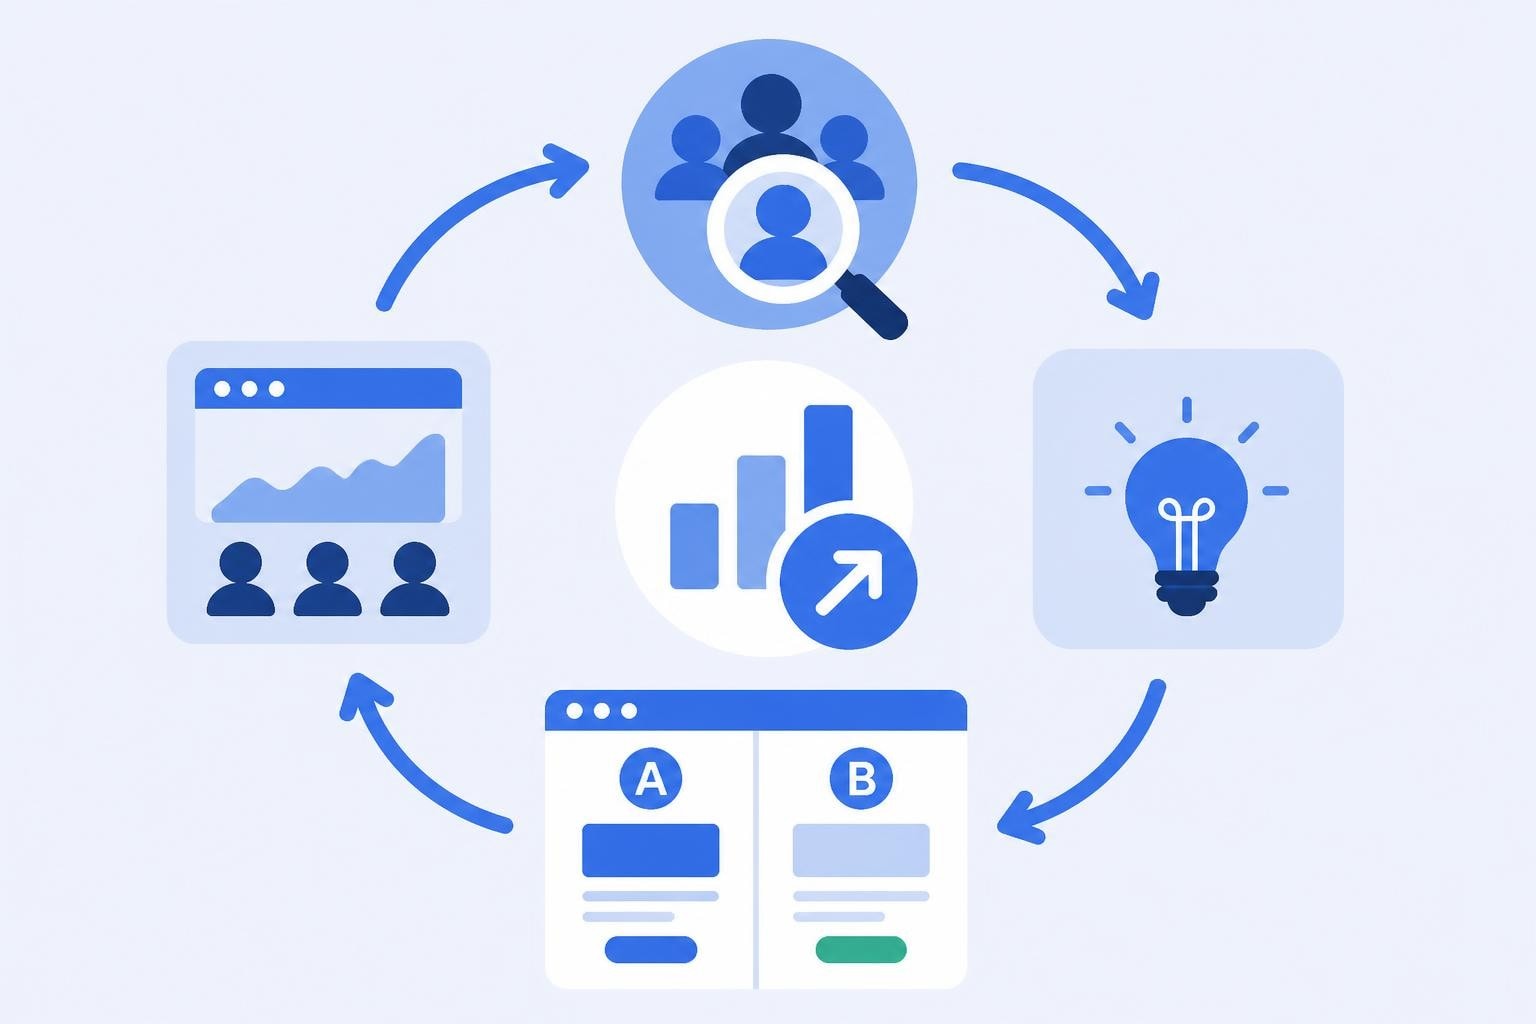
Every click represents potential revenue, but only when visitors take the action you want. For marketers and developers managing campaigns across multiple channels, the ability to optimize conversion rate determines whether traffic investment pays off or goes to waste. Conversion rate optimization combines analytics, behavioral psychology, and iterative testing to transform passive browsers into active customers, subscribers, or leads. As marketing budgets tighten and customer acquisition costs climb in 2026, understanding how to systematically improve conversion performance becomes essential for sustainable growth.
Understanding Conversion Rate Fundamentals
Conversion rate measures the percentage of visitors who complete a desired action divided by total visitors. That action might be purchasing a product, signing up for a newsletter, downloading a resource, or clicking through to a destination page. The formula remains simple: conversions divided by total interactions, multiplied by 100.
Why baseline measurement matters:
- Establishes performance benchmarks for testing
- Reveals which traffic sources deliver quality visitors
- Identifies drop-off points in user journeys
- Quantifies the impact of changes over time
Different industries and business models see vastly different baseline rates. E-commerce sites might celebrate a 2-3% purchase conversion rate, while B2B software demos might convert at 5-8% of qualified traffic. Landing pages for specific campaigns often achieve 10-15% or higher when properly targeted and optimized.
Setting up accurate measurement requires defining what counts as a conversion and implementing proper event tracking. Google Analytics 4 events provide the framework for marking these critical actions in your analytics platform, ensuring you capture meaningful data rather than vanity metrics.
The Economics of Optimization
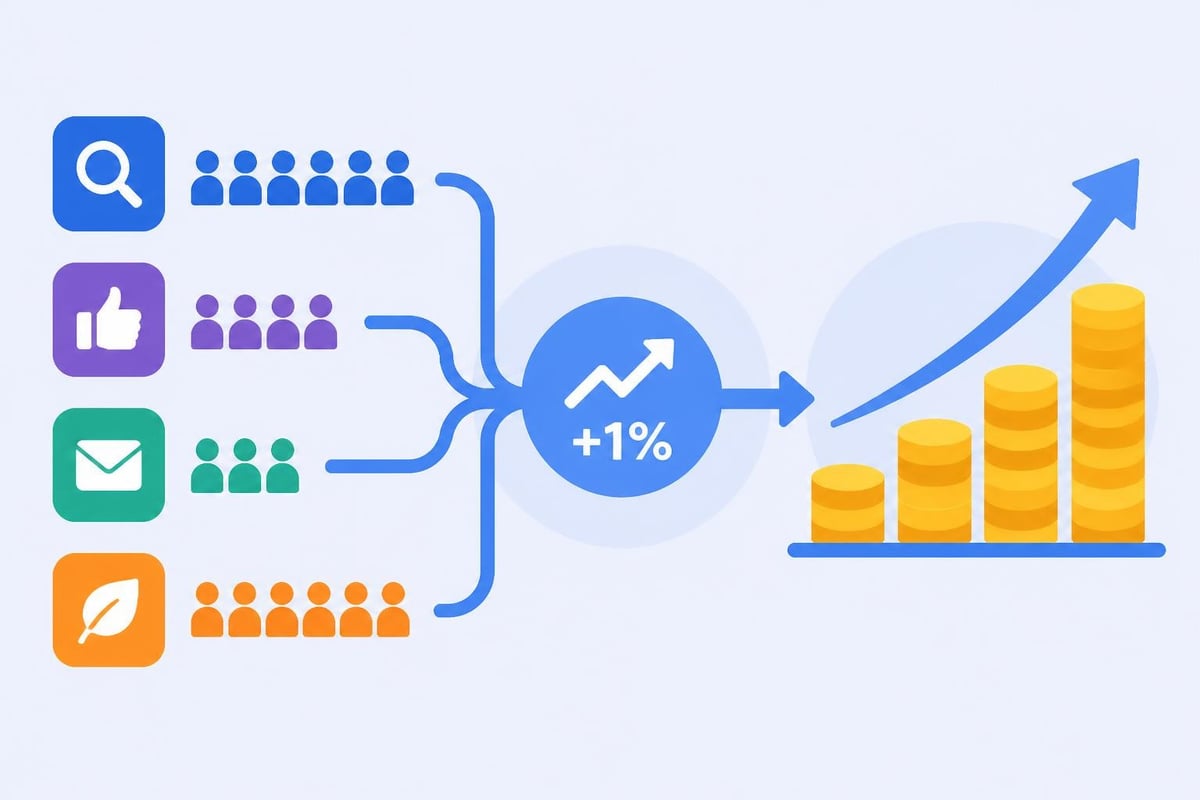
Small improvements compound dramatically at scale. A landing page receiving 10,000 monthly visitors at a 2% conversion rate generates 200 conversions. Increasing that rate to 3% yields 300 conversions-a 50% improvement in outcomes without spending additional acquisition budget.
| Metric | Before | After | Change |
|---|---|---|---|
| Monthly visitors | 10,000 | 10,000 | 0% |
| Conversion rate | 2.0% | 3.0% | +50% |
| Total conversions | 200 | 300 | +100 units |
| Value per conversion | $50 | $50 | 0% |
| Monthly revenue | $10,000 | $15,000 | +$5,000 |
This mathematical reality explains why experienced marketers prioritize conversion optimization alongside traffic generation. Doubling your traffic doubles your costs; improving conversion rates increases revenue without proportional expense increases.
Data Collection and Analysis Framework
You cannot optimize conversion rate without understanding current user behavior. Comprehensive data collection creates the foundation for identifying friction points and opportunities.
Quantitative Analytics
Traffic analytics platforms reveal where visitors arrive, which pages they view, and where they abandon your funnel. Key metrics include:
- Bounce rate by traffic source and landing page
- Session duration and pages per session
- Exit pages showing where users leave
- Device and browser breakdowns revealing technical barriers
- Geographic and demographic patterns in conversion rates
Modern link management platforms extend this analysis to the pre-click environment. When you optimize conversion rate across campaigns, understanding which specific links, messaging angles, and audience segments drive qualified traffic becomes crucial for both media spend efficiency and on-site optimization.
Qualitative Research
Numbers show what happens; qualitative research reveals why. Behavioral research methods such as session recordings, heatmaps, and user surveys expose the reasoning behind visitor decisions.
Session recordings let you watch actual users navigate your site, revealing confusion, hesitation, and unexpected interaction patterns. You might discover users repeatedly clicking non-interactive elements, missing critical calls-to-action, or getting lost in navigation.
Heatmaps aggregate click, scroll, and movement data across many sessions, showing which page elements attract attention and which go unnoticed. This visual data helps prioritize page redesigns and identify whether users even see your conversion elements.
User surveys and feedback tools capture direct explanations for abandonment. Exit-intent surveys asking "What prevented you from completing your purchase today?" often surface objections, missing information, or concerns that quantitative data cannot reveal.
Hypothesis-Driven Testing Methodology
Random changes rarely improve performance consistently. Successful conversion optimization follows a structured process: observe, hypothesize, test, analyze, iterate.
Building Strong Hypotheses
Effective test hypotheses connect observed problems to proposed solutions with clear reasoning. The format: "Because we observed [data point], we believe [change] will cause [outcome] for [audience segment]."
Example: "Because session recordings show 40% of mobile users abandoning the checkout form at the shipping address field, we believe reducing the shipping form from 8 fields to 4 required fields will increase mobile checkout completion by 15%."
This structure forces you to:
- Ground tests in actual data rather than opinions
- Specify expected impact magnitude
- Identify affected user segments
- Create measurable success criteria
A/B Testing Best Practices
A/B testing compares two versions of a page, email, or experience to determine which performs better. Proper implementation requires statistical rigor to avoid false conclusions.
Sample size and duration considerations:
- Run tests until reaching statistical significance (typically 95% confidence)
- Account for weekly patterns by testing full week cycles
- Calculate minimum sample size before starting based on expected effect size
- Avoid stopping tests early when results look favorable (increases false positive risk)
The systematic literature review of A/B testing methodologies highlights common pitfalls including multiple comparison problems, selection bias, and interference between variants. Professional marketers address these through proper randomization, holdout groups, and conservative statistical thresholds.

Multivariate and Sequential Testing
When you need to optimize conversion rate across multiple elements simultaneously, multivariate testing evaluates combinations of changes. Testing headline, image, and call-to-action button variations together reveals interaction effects that sequential A/B tests might miss.
However, multivariate tests require substantially more traffic to achieve significance. A test with 3 headlines, 2 images, and 2 button colors creates 12 combinations, requiring 12× the sample size of a simple A/B test.
Sequential testing provides an alternative: prioritize elements by expected impact, test them individually, implement winners, then move to the next element. This approach works better for moderate-traffic situations where multivariate testing would take months to conclude.
Technical Optimization Fundamentals
Technical performance directly impacts conversion rates. Slow loading, broken functionality, and poor mobile experiences create friction that drives visitors away before they can convert.
Page Speed and Core Web Vitals
Every additional second of load time correlates with measurable conversion rate decline. Research consistently shows:
| Load Time | Relative Conversion Rate |
|---|---|
| 0-2 seconds | Baseline (100%) |
| 3 seconds | -12% |
| 5 seconds | -38% |
| 10 seconds | -72% |
Focus on Largest Contentful Paint (how quickly main content loads), First Input Delay (how soon the page becomes interactive), and Cumulative Layout Shift (whether elements move unexpectedly during loading).
Common technical optimizations include image compression, browser caching, content delivery networks, lazy loading for below-fold content, and minimizing third-party scripts. Testing these improvements separately lets you quantify their conversion impact.
Mobile Responsiveness
Mobile devices account for over 60% of web traffic in 2026, yet many sites still treat mobile as an afterthought. Touch targets must be large enough for finger interaction (minimum 44×44 pixels), forms should minimize typing with smart input types, and critical information must appear above the fold.
Accessibility improvements benefit all users while expanding your addressable market. Proper heading structure, color contrast, keyboard navigation, and screen reader compatibility remove barriers for users with disabilities and often improve general usability simultaneously.
Persuasion and Trust Elements
Visitors must trust you before they convert. Digital credibility and persuasion principles shape whether users feel confident enough to share information, make purchases, or commit to actions.
Credibility Signals
Research on web credibility identifies design quality, information clarity, and third-party endorsements as primary trust factors. Professional design communicates competence and reliability, while poor design triggers skepticism regardless of actual business legitimacy.
Essential credibility elements:
- Clear contact information and physical address
- Security certificates and trust badges
- Professional photography and copywriting
- Transparent policies (return, privacy, terms)
- Real testimonials with full names and photos
- Media mentions and industry certifications
Social proof-evidence that others have successfully used your product-reduces perceived risk. Display recent purchase notifications, customer counts, review ratings, and case studies strategically near conversion points.
Friction and Urgency Balance
Every form field, navigation step, and decision point adds friction. The art of conversion optimization involves removing unnecessary friction while maintaining essential information collection.
Friction reduction tactics:
- Single-column layouts that create clear visual paths
- Progressive disclosure revealing complexity only when needed
- Autofill support for addresses and payment information
- Guest checkout options eliminating account creation requirements
- Clear progress indicators in multi-step processes
E-commerce checkout research demonstrates that average cart abandonment rates exceed 70%, with complicated checkouts being the primary driver. Simplifying checkout flows consistently ranks among the highest-impact conversion optimizations.
Urgency and scarcity can motivate action when authentic. Limited inventory counts, time-sensitive discounts, and seasonal availability create legitimate reasons to act now rather than later. However, fabricated urgency ("only 2 left!" when inventory is unlimited) damages credibility when discovered.
Campaign-Level Optimization Strategy
To truly optimize conversion rate, you must analyze performance across your entire marketing ecosystem, not just landing pages in isolation.
Traffic Quality and Message Match
Not all visitors hold equal conversion potential. Traffic from a targeted LinkedIn campaign to B2B decision-makers converts differently than visitors from a viral social post. Understanding traffic quality helps you optimize conversion rate by segment rather than chasing a single blended metric.
Message match ensures the promise made in your ad, email, or link matches what visitors encounter upon arrival. When a user clicks "Get 50% off premium features," they expect to land on a page prominently featuring that offer, not a generic homepage. Misalignment between click expectation and landing experience kills conversions immediately.
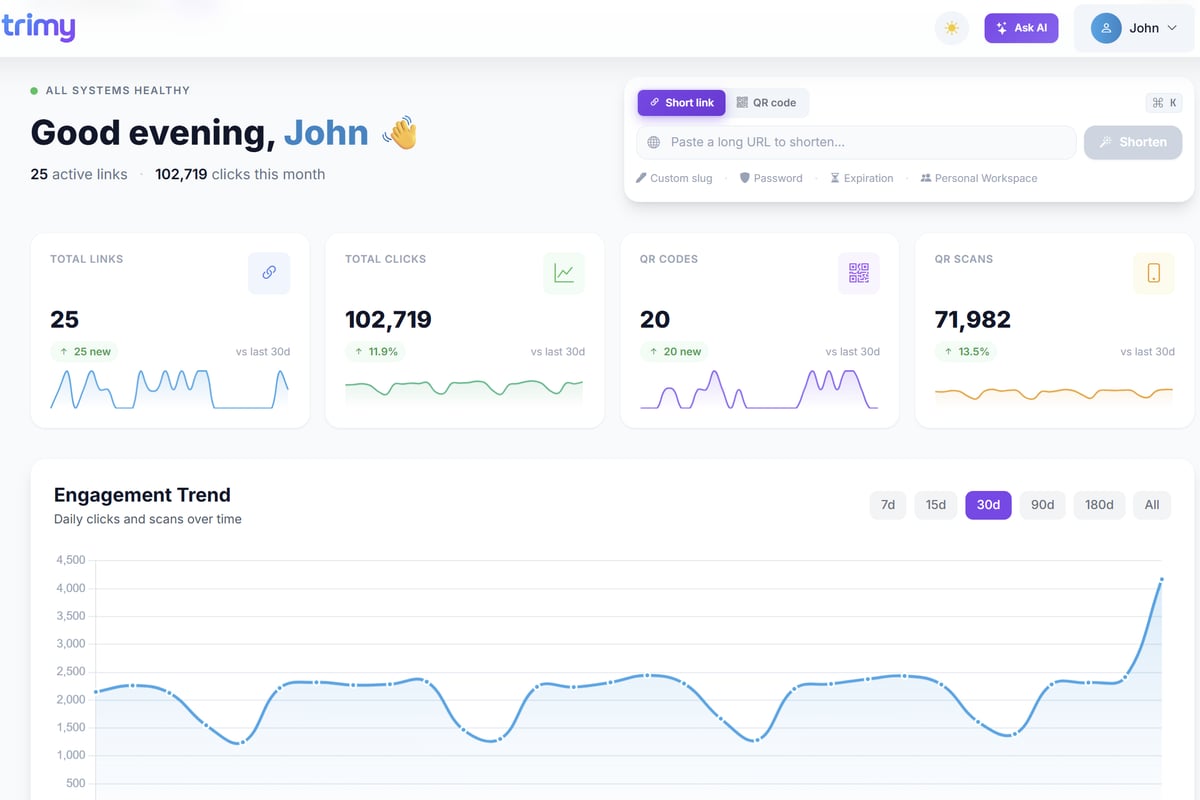
Link-level analytics reveal which specific campaigns, creatives, and channels deliver high-intent visitors. When you can attribute conversions back through campaign links to specific messaging angles or audience segments, you gain the intelligence needed to optimize both acquisition and conversion simultaneously.
Trimy provides this link-level intelligence, allowing marketers to track not just clicks but downstream conversion behavior by campaign link. The platform's A/B testing capabilities let you experiment with different destination pages for the same campaign, identifying which landing experiences convert specific traffic sources most effectively.
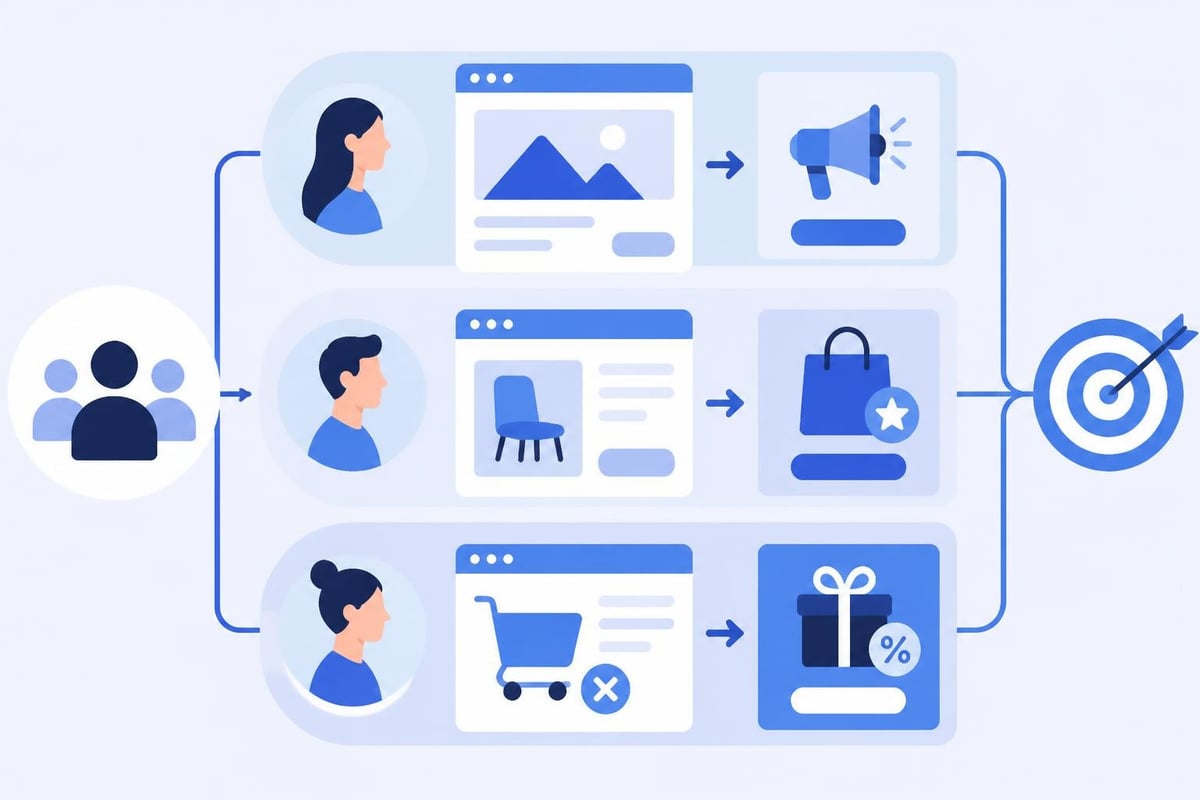
Retargeting and Nurture Sequences
Most visitors will not convert on first visit. Systematic retargeting brings them back with relevant messaging based on their previous behavior.
Segment retargeting audiences by:
- Pages viewed (product detail viewers vs. homepage browsers)
- Exit point (cart abandoners vs. early exits)
- Time since visit (same-day vs. week-old visitors)
- Device used (mobile browsers who might convert on desktop)
Each segment deserves tailored messaging addressing their specific position in the consideration journey. Cart abandoners need incentive or reassurance; early exits might need more education about value.
Personalization and Segmentation
Generic experiences convert everyone equally poorly. Personalization and experimentation strategies demonstrate that tailoring content, offers, and experiences to visitor characteristics significantly improves relevance and conversion rates.
Behavioral Segmentation
Segment visitors by observable behavior rather than demographics:
- First-time vs. returning visitors need different information
- Traffic source indicates intent and awareness level
- On-site behavior (pages viewed, time spent, scroll depth) reveals interest
- Previous conversions show relationship stage
Display different calls-to-action, testimonials, or offers based on these segments. New visitors from paid search might see educational content establishing value, while returning visitors who previously downloaded a resource might see a direct purchase offer.
Dynamic Content Optimization
Modern platforms enable real-time content adaptation based on visitor attributes. Show different hero images based on geographic location, adjust product recommendations based on browsing history, or modify headline messaging based on referring campaign.
Start with high-impact, low-complexity personalizations:
- Geographic customization (language, currency, local examples)
- Returning visitor recognition (skip introductory content)
- Device-specific layouts (mobile-optimized forms)
- Traffic source-specific landing pages (message match)
Each personalization represents a hypothesis about what makes specific segments more likely to convert. Test systematically rather than implementing all variations simultaneously to isolate impact.
Measurement and Attribution
Accurate measurement ensures you optimize conversion rate based on reality rather than misleading data. Attribution models determine how credit for conversions distributes across multiple touchpoints in the customer journey.
Attribution Model Selection
A customer might see a social ad, click an email link days later, then convert via direct visit. Which touchpoint gets credit? The answer affects optimization decisions.
| Attribution Model | Credit Distribution | Best For |
|---|---|---|
| Last-click | 100% to final touchpoint | Simple sales, short cycles |
| First-click | 100% to initial touchpoint | Awareness-focused campaigns |
| Linear | Equal credit to all touchpoints | Relationship-building funnels |
| Time-decay | More credit to recent touches | Considered purchases |
| Data-driven | Algorithmic based on patterns | High-volume, complex journeys |
Most businesses benefit from comparing multiple models rather than relying on one exclusively. Last-click attribution might show email performing best while first-click reveals social driving initial awareness that leads to eventual email conversions.
Conversion Path Analysis
Understanding common paths to conversion reveals optimization opportunities. If analysis shows most converters view specific pages before purchasing, you can strengthen those pages and ensure they are easily accessible.
Identify:
- Critical pages most converters view
- Drop-off points where potential converters exit
- Unnecessary steps in the conversion funnel
- Accelerator content that shortens time-to-conversion
This analysis often reveals that visitors need specific information-pricing details, comparison charts, security assurances-before converting. Making this information more accessible earlier in the journey reduces friction and improves conversion rates.
Continuous Optimization Culture
You never truly finish conversion optimization. Market conditions change, competitors adapt, customer preferences evolve, and new channels emerge. Sustainable success requires embedding optimization into ongoing operations rather than treating it as a one-time project.
Building a Testing Roadmap
Maintain a prioritized backlog of test hypotheses ranked by:
- Expected impact (potential conversion rate improvement)
- Confidence level (strength of supporting evidence)
- Implementation effort (development and design resources required)
- Risk (potential negative effects if hypothesis proves wrong)
Focus on high-impact, high-confidence, low-effort tests first. These "quick wins" build momentum and stakeholder buy-in for larger, riskier experiments later.
Cross-Functional Collaboration
Effective conversion optimization requires input from multiple perspectives. Designers understand visual hierarchy and user experience, developers know technical constraints and possibilities, copywriters craft persuasive messaging, and data analysts identify patterns and opportunities.
Regular optimization meetings should review:
- Recent test results and learnings
- New behavioral data or customer feedback
- Competitor activity and market changes
- Upcoming tests and resource allocation
This collaborative approach prevents siloed optimization where landing page teams improve conversion while email teams unknowingly send misaligned messages that hurt overall performance.
Learning from Failed Tests
Most tests fail to improve conversion rates. This outcome provides valuable information rather than representing wasted effort. Failed tests reveal what does NOT matter to your audience, letting you avoid similar approaches and focus testing resources elsewhere.
Document test results thoroughly: what you tested, why you tested it, what happened, and what you learned. This institutional knowledge prevents repeatedly testing similar hypotheses and helps new team members understand what has already been tried.
Key documentation elements:
- Hypothesis and supporting reasoning
- Test design and variants
- Sample size and duration
- Results with confidence intervals
- Secondary metrics affected
- Implementation decisions and learnings
Over time, this database reveals patterns about what works for your specific audience, creating a proprietary understanding of conversion drivers that competitors cannot easily replicate.
Optimizing conversion rate transforms marketing efficiency by extracting more value from existing traffic, reducing customer acquisition costs, and accelerating revenue growth. The strategies outlined here-rigorous testing, technical excellence, behavioral research, and systematic measurement-create a foundation for continuous improvement that compounds over time. Trimy empowers marketers and developers to implement these strategies through advanced link analytics, A/B testing capabilities, and deep campaign insights that connect traffic sources to conversion outcomes, turning every link into an opportunity for optimization and growth.